Test run dashboard
What is a dashboard in a test run?
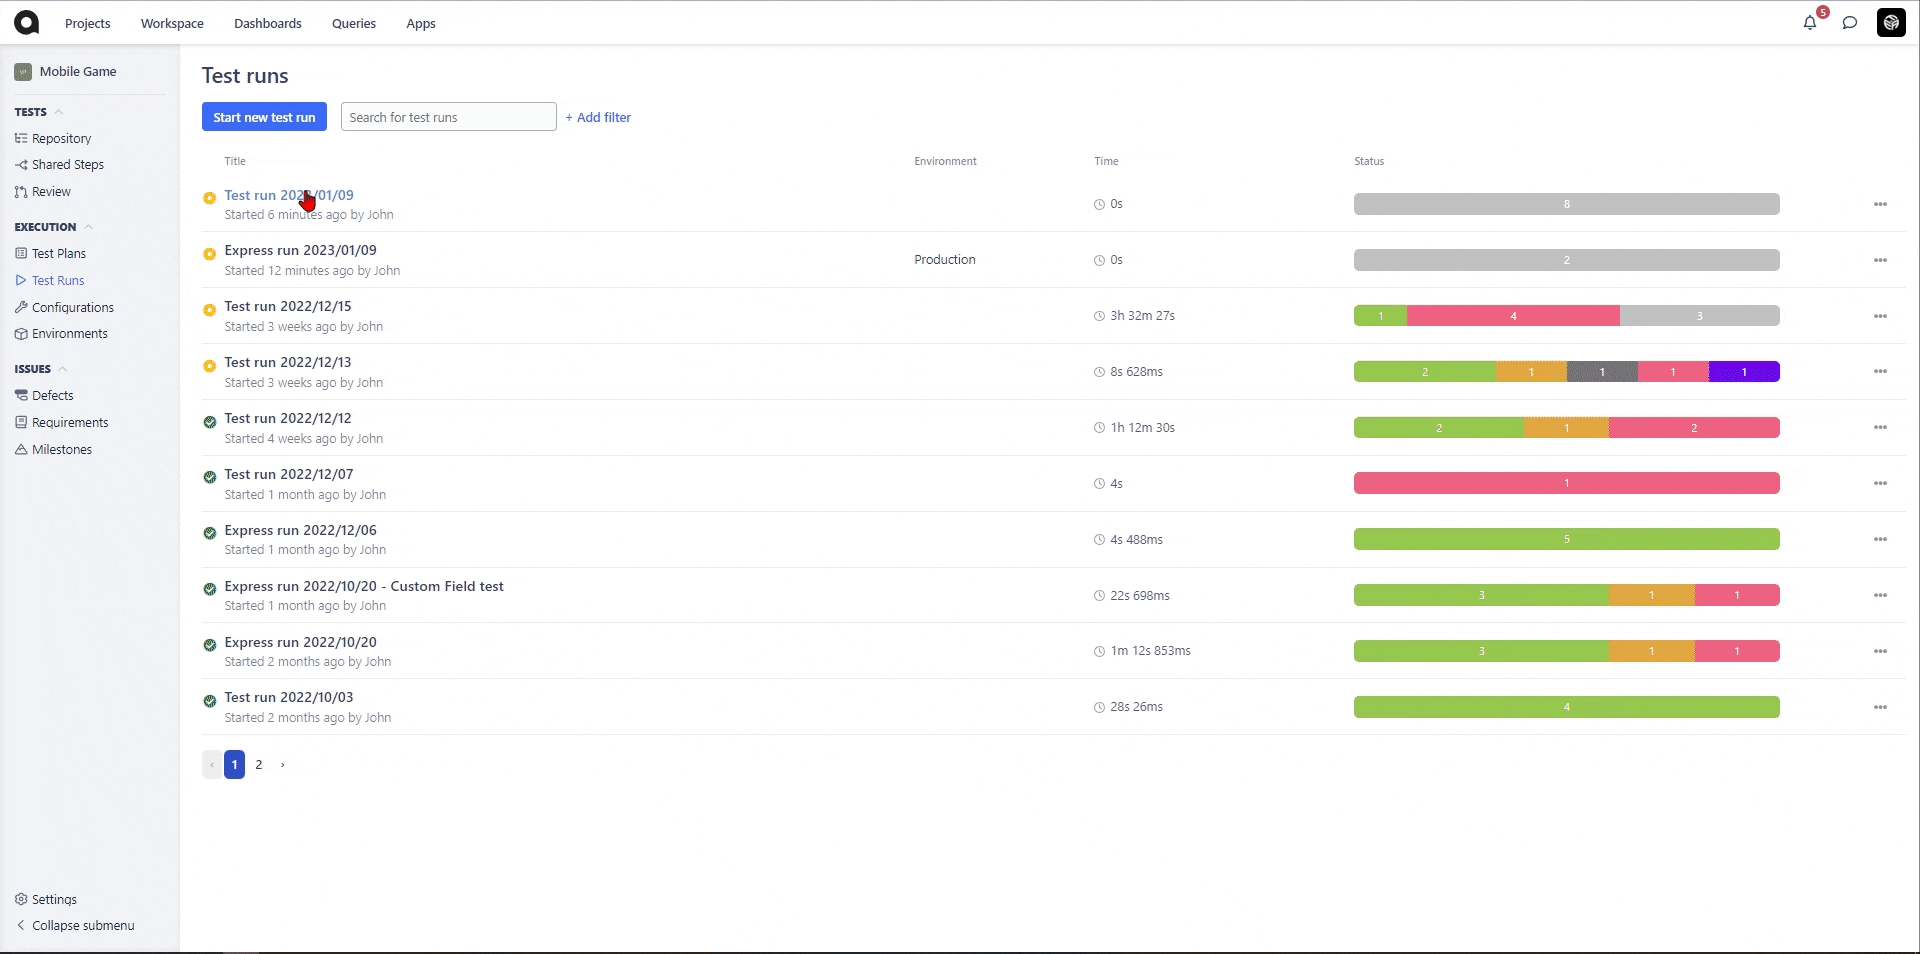
The dashboard is a detailed overview of a test run and various cases it contains. You can access it either from the three-dots-menu or by clicking the test run name in the test runs section:
What actions are available on the dashboard?
From the Dashboard, you can:
Open wizard: the wizard will guide you through the test cases contained in the run, step-by-step.
Share Report: provide access to a report to anyone who needs to track testing progress - even if they are not your Qase account members - with a public link.
Export: download a CSV or PDF export of your test run.
Edit: change the properties of your test run - title, description, environment, milestone, and included test cases.
Abort: cancel the test run if it no longer needs to be performed.
"Test cases" and "Team stats" tabs
There are two tabs in the test run dashboard: test cases, and team stats. Once you create at least one defect during the test run, there will be another tab “Defects” to track all defects.
"Test cases" tab
In the test cases tab, you can search for cases in a test run by title, and filter by specific parameters:
For a test case that has not been performed yet, the three-dot-menu button allows you to edit case, run wizard, assign it to a specific user, assign it to yourself, view case details or delete it.
For a test case, that has already been performed, the options available are to edit case, re-test case, view its details, or delete.
If a test case needs to be re-tested, you can only do a few things with it: run wizard, assign case, unassign case, view case details, or delete it.
Selecting multiple cases in a run, you can perform bulk actions on those test cases: re-test, assign to a user, unassign, or remove from the run:
"Team stats" tab
The team stats tab shows information about all the teammates who participated in the test run, including their working time, results, and performance over time.
On the right side of the test run view, there is a test run details sidebar. It provides you with the vital details of your test run:

Donut Graph: shows the breakdown of test cases in the run by status. Hovering over a section of the graph you will see the actual number of cases in a respective status. If you click on a section of the graph, a quick filter will be applied to show you only the cases in a specific status.
Completion rate: represents the percentage of cases in a run that have been performed so far.
Started by and Start time: provide details on who started this test run, and when.
Estimated: based on how much time has been spent in the previous test runs on test cases included in your current test run, Qase provides you with a prediction on how long your current test run is likely to take.
Time Spent: the summary of time that has been spent on test cases in the current test run so far.
Environment, Tags, Configurations and Custom Fields: Details about the specific environment of the test run and the associated tags.
Integrations: You have the option to integrate your test run with any of the installed Apps in your Workspace. To integrate an app's issue with the test run, please follow these steps:
Navigate to the test runs page
Click on the Run which you would like to Integrate with an issue from a 3rd party app
In the side-bar to your right, please click on the "Select an Integration" button under "External Issue"
Click on the App whose issue you'd like to Integrate with the run
Search for the issue id and click on "Link"
Here's a GIF of the steps to be followed to integrate a run with an issue from a 3rd party App:
Last updated